Modelling software quality
The notion of software quality is usually captured in a model that depicts the composite characteristics and their relationships.
Early models
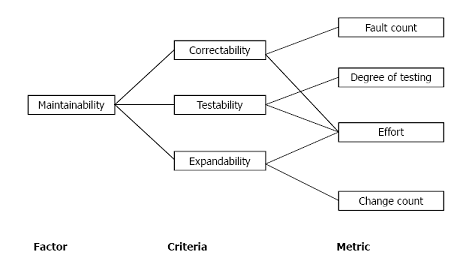
These included using a decompositional approach.
- Quality factors (key attributes from the user's perspective)
- Quality criteria (further decomposed from quality factors)
- Quality metrics (directly measurable attributes)
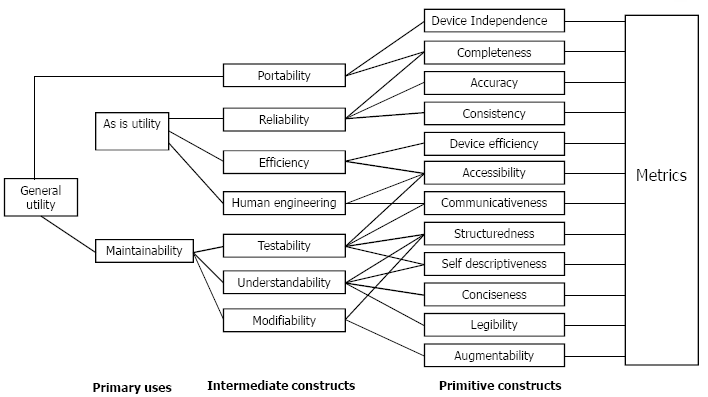
Example: Boehm model
"Define your own quality model" approach
This is done by:
- Reaching a consensus on which quality attributes are important for a given product among prospective users
- Deciding on a decomposition guided by an existing model
- Defining specific measures for the lowest-level attributes
Defect-based quality measure
A defect is interpreted to mean a known error, fault or failure. We can define two categories of these:
- Known defects: have been discovered through testing / inspection and other techniques
- Latent defects: may be present in the system but of which we are unaware
Defect density measures are defined as:
- defect density = number of known defects / product size
Defect counts have historically included: post-release failure, residual faults (all defects discovered after release), all known faults, the set of faults discovered after some arbitrary fixed point in the SDLC (ie: unit testing).
System spoilage is defined as:
- t / SDT
Where t: time to fix post-release defects, SDT: total system development time.
Usability measures
The usability of software is the extent to which the product is convenient and practical to use. Although usability has received widespread attention throughout the software community, there are few agreed measures that capture our intuitive meaning about usability.
We can use reliability as an analogy to define usability formally as:
- The probability that the operator of a system will not experience a user interface problem during a given period of operation under a given operational profile
- Here the operational profile represents the way in which we expect the user to interact with the system over time.
A simple approach to this may be looking for internal characteristics that we think lead to good usability. For instance:
- Well structured user manuals
- Good use of menus & graphics
- Informative error messages
- Help functions
- Consistent interfaces
An external view of usability can be described as concerning the effort required for learning and operating the system. Task effectiveness (TE) is defined as:
- TE = quantity * quality / 100* Where quantity: amount/number of task(s) completed (%), quality: quality of goals achieved (%).
Maintainability measures
Software maintainability involves several types of changes.
- Corrective changes: fixing defects
- Adaptive changes: hardware is changed or part of the software is upgraded
- Preventive change: combing the code to find faults before they become failures
- Perfective change: rewriting documentation / comments or adding new functionality to a working system
These changes involve the specification, design, test plan and code (ie: all aspects of the SDLC). Maintainability is dependent not only on the product but also on the person performing the maintenance, the supporting documentation and tools and the proposed usage of the software.
External view of maintainability
The external (and more direct) approach to measuring maintainability is to measure the maintenance process. If the process is effective, then we assume the product is maintainable.
Mean-time-to-repair (MTTR) is the average time it takes the maintenance team to implement a change and restore the system to working order.
To calculate MTTR we need:
- Problem recognition time
- Administrative delay time
- Maintenance tools collection time
- Problem analysis time
- Change specification time
- Change time(including testing and review).
Other measures may be useful if the relevant data is collected and available. For example:
- Ratio of total change implementation time to total number of changes implemented
- Number of unresolved problems
- Time spent on unresolved problems
- Percentage or changes that introduce new faults
- Number of modules modified to implement a change
These measures reflect the degree of maintenance activity and the effectiveness of the maintenance process. An actual measure can be derived from these measures, depending on the goals and needs of the organisation.
Internal view of maintainability
This approach involves identifying internal product attributes (ie: structure of the product). Numerous measures of internal attributes have been proposed as indicators of maintainability. To determine which measures (in relation to internal attributes) most affect maintainability, we must gather them in combination with external maintainability measures.
Readability for textual product
For text-based products readability is believed to be a major aspect of maintainability. The internal attributes determining the structure of documents are considered to be the important indicators of readbility.
The most well-known readability measure is Gunning's Fog Index F.
F = 0.4 x (number of words / number of sentences + percentage of words of 3 or more syllables
Readability for source code
In 1979 De Young and Kampen defined the readability R of programs as..
R = 0.295 a - 0.449 b + 0.13 c
Where:
- a: acerage normalised length of variables
- b: number of lines containing statements
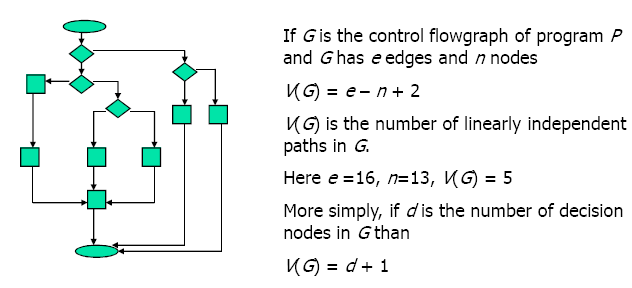
- c: McCabe's cyclomatic number
McCabe's cyclomatic number
McCabe's cyclomatic number is an indicator of the complexity of a program. Modules with high cyclomatic numbers are likely to be fault-prone and not-maintainable.